Introduction
SNR 610
- Before we can start the class, we need to take a statistics refresher
Questions
- What is statistics?
- What is a population? What is a sample?
- What is a parameter? What is a statistic?
Discuss, and answer in your own words.
Statistics
There are many definitions.
My favorite definitions: * Statistics is the science of learning from data in the face of uncertainty. * Statistics is the study of uncertainty and variability.
Statistical models are not deterministic, they are probabilistic. They are used to describe the uncertainty in the data.
Statistics
- “The study of the collection, analysis, interpretation, presentation, and organization of data (Dodge 2006)”
- Or simply: “a very educated guess”
Population vs Sample
A population is the entire set of individuals or items that we are interested in studying.
Population: “all subjects of interest”
Biological meaningful
A sample is a subset of the population that we actually observe or collect data from.
Sample: “a subset of the population”
Population vs Sample
If we collect data from the entire population, there is no need for inference.
Why?
Definitions
- Population: The group towards which scientists attempt to generalize
- Census: A study which includes all members of the population
- Sample: A portion of the population which is part of the study
- Study design: The process of obtaining the best sample to answer the research questions
- Inference: The process of making generalizations about the population
- Descriptive statistics: Methods for summarizing and/or presenting data
- Inferential statistics: Methods for making generalizations about a population using information contained in the sample
Data
- What is data?
- Types of data/variables?
- What are observations? What are variables?
Observations and variables
variables
data
an
observation
| site | latitude | size | air_temp |
|---|---|---|---|
| PIE | 42.7 | 21.2 | 10.293 |
| PIE | 42.7 | 18.75 | 10.293 |
| PIE | 42.7 | 19.51 | 10.293 |
| PIE | 42.7 | 17.58 | 10.293 |
| PIE | 42.7 | 21.19 | 10.293 |
| PIE | 42.7 | 18.67 | 10.293 |
| PIE | 42.7 | 18.94 | 10.293 |
| PIE | 42.7 | 16.29 | 10.293 |
| PIE | 42.7 | 19.37 | 10.293 |
| PIE | 42.7 | 17.52 | 10.293 |
| GTM | 30 | 12.43 | 21.792 |
| GTM | 30 | 11.84 | 21.792 |
| GTM | 30 | 11.58 | 21.792 |
| GTM | 30 | 14.55 | 21.792 |
Types of variables
Categorical
qualitative
Numerical
quantitative
Nominal
no order
Ordinal
ordered
Discrete
counts
Continuous
measurements
Species, site, treatment
bass, trout, bluegill
Condition
poor, ok, great
Abundance
0, 1, 2, 3, 4…
Length, biomass, temperature
12.4 cm, 27.8 g, 21.5°C
Extra numerical distinction:
Temperature in °C is interval scale because 0°C is not “none.”
Length, biomass, and abundance are ratio scale because 0 means none.
Some more refreshers
- What is accuracy? What is precision?
- What is bias? What is variability?
- Why might we intentionally accept more bias in a model in order to reduce variance? –> We do this very often!
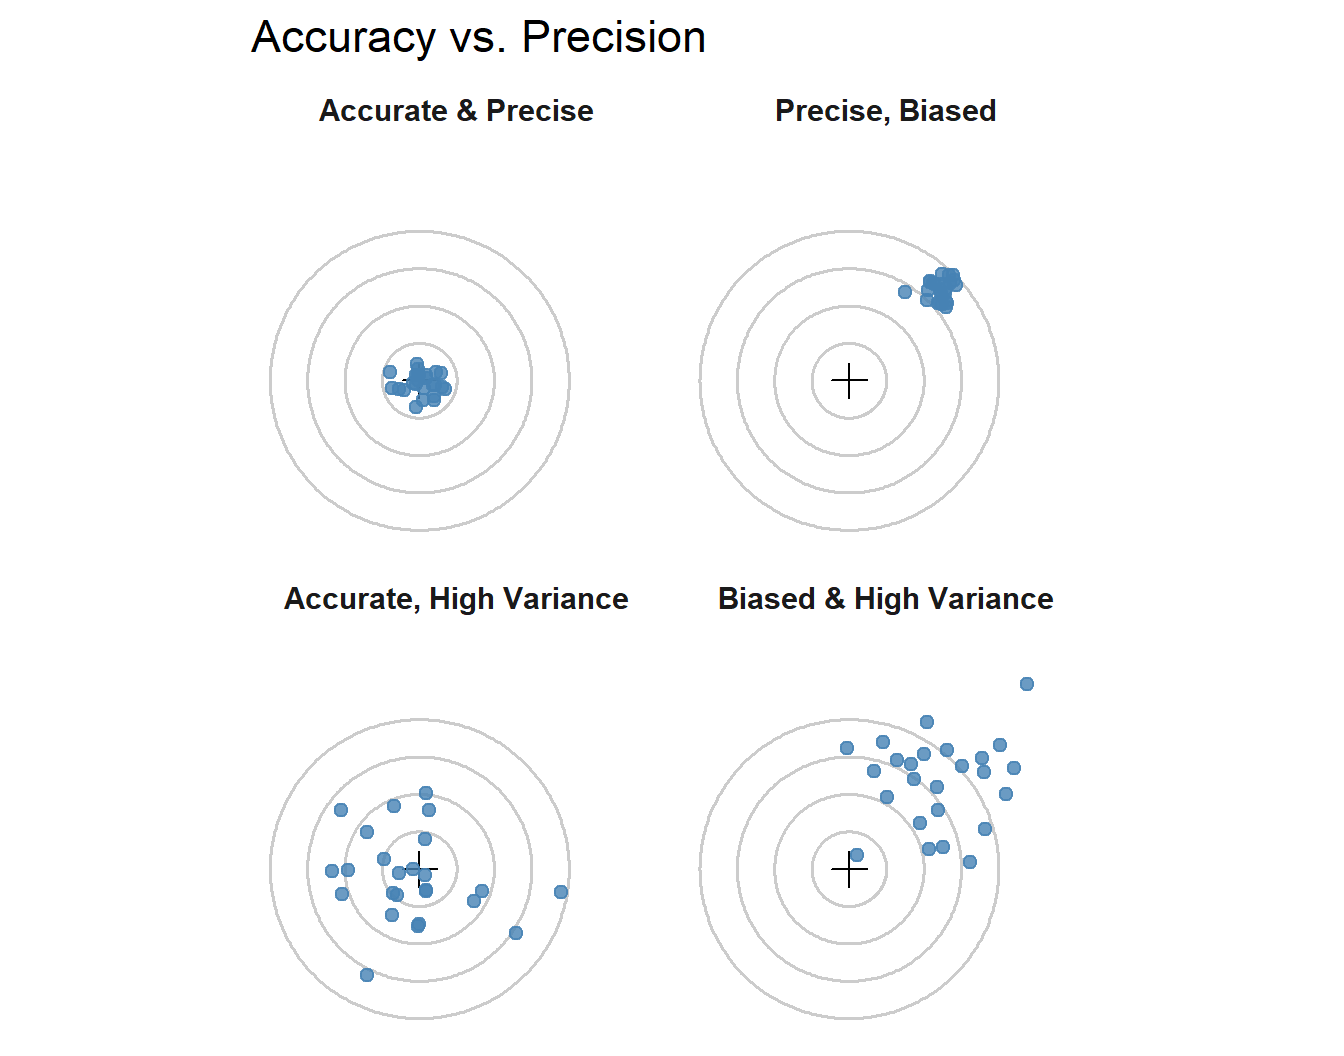
Accuracy and precision
- Accuracy: how close a measurement is to the true value
- Precision: how close repeated measurements are to each other
- Bias: systematic error that causes measurements to be consistently off from the true value
- Variance: the degree to which repeated measurements vary from each other
Accuracy and Precision
Mean and variance
- Mean: the average of a set of values
- Variance: a measure of how much the values in a set differ from the mean
- Standard deviation: the square root of the variance, which gives a measure of spread in the same units as the data
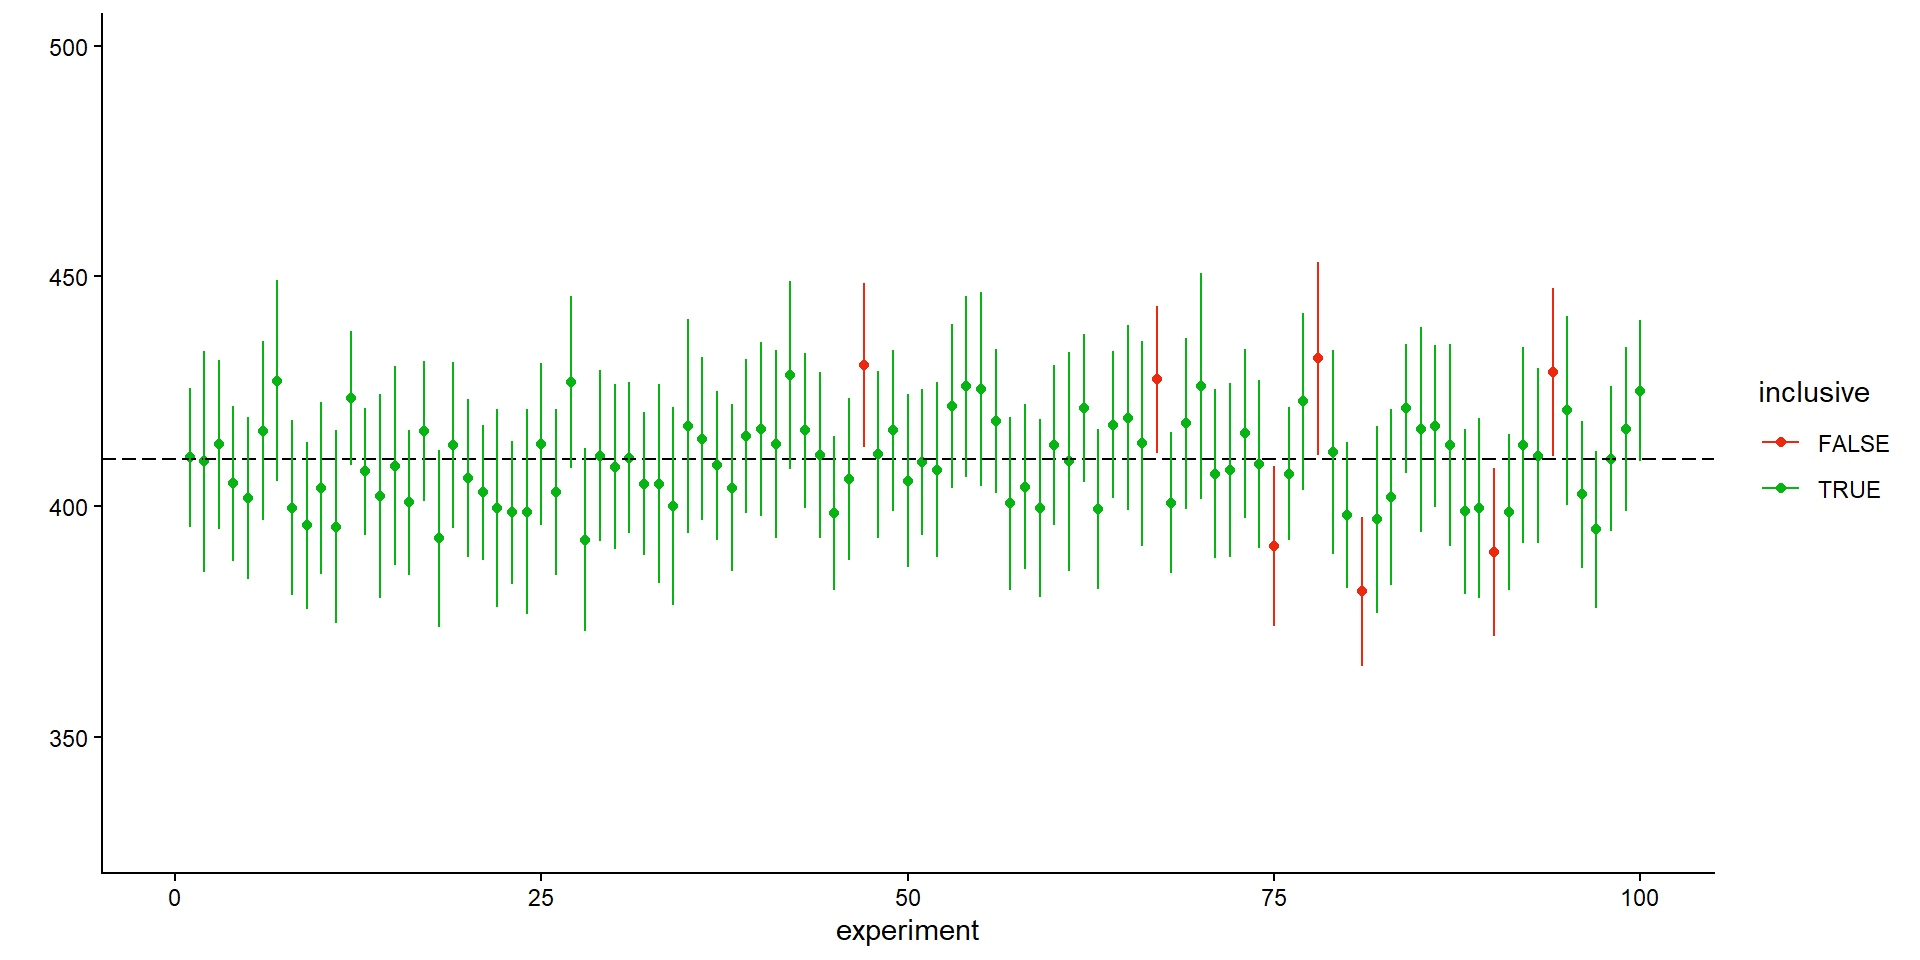
Central Limit Theorem
The central limit theorem states that the distribution of the sample mean will be approximately normally distributed, regardless of the shape of the population distribution, as long as the sample size is sufficiently large (usually n > 30).
CLT
Probability and Likelihood
- What is probability? What is likelihood?
Probabiliy and Likelihood
- Probability: the chance of observing a particular outcome given a known model or distribution
- Likelihood: the plausibility of a model or estimate given observed data
Probability and inference
Statistical inference is founded in the ability to quantify uncertainty.
We use probability to quantify uncertainty in our estimates and predictions.
Probability tells us how likely a particular outcome is, given a known model or distribution.
Next Class
Please read teh following by next Monday https://collinn.github.io/sbi/index.html
An Intuitive, Interactive, Introduction to Biostatistics by Caitlin Ward and Collin Nolte
Submit questions you may have.